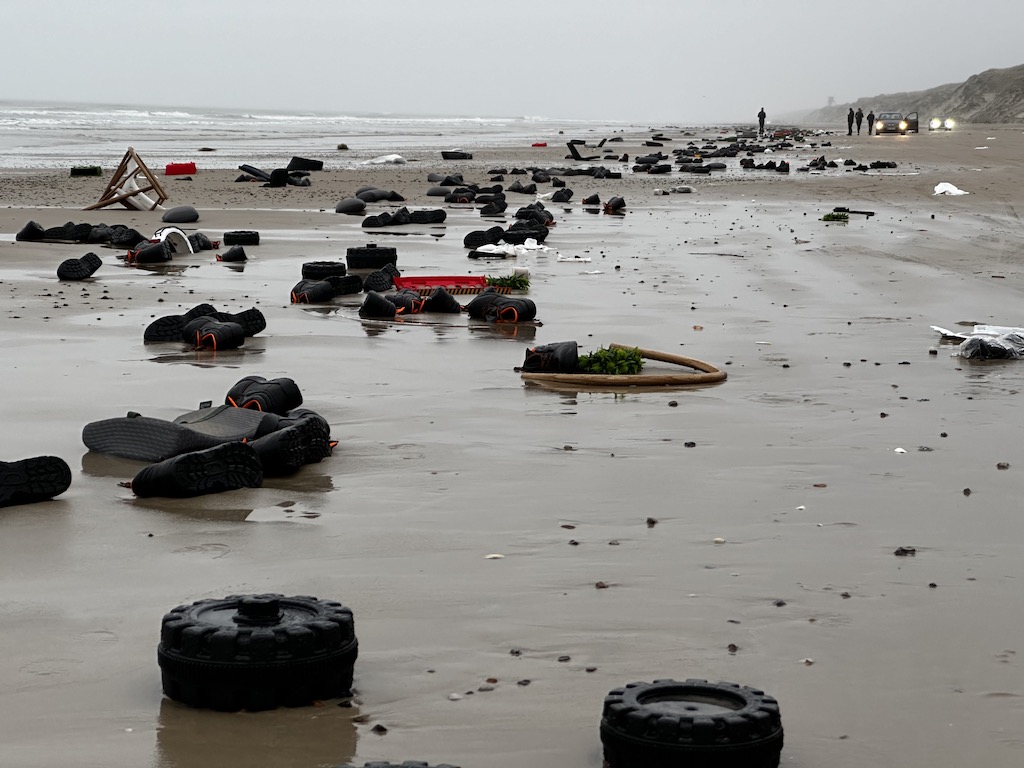
Norway’s marine insurer Gard has issued a new study which looks into the impact of weather on container stack collapses. The findings show the impact of progressively increasing wave height, the quantified risk of high waves, and variance in weather exposure among different operators.
Containerized trade has been growing steadily as the global economy expands. Last year, the global container shipping fleet grew by almost four per cent according to UNCTAD, and in Gard’s P&I portfolio, the segment has increased by as much as 16 per cent over the past five years. It currently makes up 18 per cent of its insured vessels.
With more container shipping comes also a higher risk of casualties. Certain incidents, such as stack collapses or containers lost at sea, are monitored closely as they tend to be relatively more severe.
Container losses also have the IMO’s attention, and they are working on making reporting of lost containers mandatory. Insurers and other key stakeholders are involved in detailed projects to investigate the causes of stack collapse and seek solutions.
Data analytics
To contribute to the industry understanding and to help prevent losses, Gard studied all cases of stack collapse between 2016-2021 where it was involved as a P&I insurer.
The study examined weather data to understand the factors contributing to these incidents. The data was combined with geographical and meteorological data from Windward, which includes estimated wave height and wind strength on an hourly basis.
Impact of vessel’s size
Analysing incident numbers relative to number of vessels in Gards’s portfolio provides valuable insights on claims frequency across different size segments, which can range from feeders (less than 3,000 teu) to ultra-large container vessels (ULCVs) exceeding 15,000 teu where the stack heights can exceed 10 high on deck.
Despite a higher number of incidents on smaller vessels, there is a clear correlation between incident frequency (or likelihood) and vessel size. The 6-year average claims frequency for stack collapses on feeder vessels is 1%, whereas for ULCVs, it rises to 9%.
Higher waves – higher risks
To further study the exposure to high waves, Gard looked at vessels that are exposed to a wave height of 7m (corresponding to Bf 8 gale force winds) or above. An observation of interest was that while vessels involved in incidents spent only 5% of their time in wave heights exceeding 7 meters during the incident year, half of all incidents occurred during such conditions.
Another finding Gard had was that among the vessels that had a stack collapse incident, the share of vessels exposed to such high waves increased by almost 12 times from day 1 to day 7. This suggests that these vessels may not have been able to avoid such heavy weather in spite of the advanced weather routeing tools available.
Examining the global container fleet, roughly 3.4 per cent are exposed to such weather at any given time. Interestingly, among various size segments, the new Panamax 1 segment (8,000 – 12,000 teu) appears to have a higher exposure to wave heights of 7 meters and above compared to any other size category. This trend is also evident for wave heights around 4 meters.
Differing risk profiles
A study carried out by Gard, which covers the period 2026-2022, shows that some container operators or owners are more exposed to the risk of adverse weather than others.
In essence, this discrepancy likely stems from differences in operators’ risk tolerance and the internally defined weather thresholds for the vessels. However, the consequences of decisions made in the chartering or the operator’s desk are quite evident in the safety of the vessel and the cargo, as Gard notes.
Suitable tools for complex rolling phenomena
Furthermore, the study emphasizes that seafarers should have access to suitable digital / automated tools for evaluating the risk of intricate phenomena like resonant, synchronous, and parametric rolling.
Tighter weather routeing for vessels with deteriorated securing equipment
As it is pointed out containers continue to be loaded in affected slots, and repairs are postponed until drydock for commercial reasons. “Our recommendation is of course that affected slots be taken out of service until repairs are carried out, but from a pure routeing perspective, weather thresholds might need to be adjusted for such vessels,” Gard notes.
Broadening KPIs for weather routeing
Gard also raised the question if safe weather routeing and the avoidance of adverse weather should be included as components of internal key performance indicators (KPIs).
“Modern digital tools make it much easier to assess a vessel’s or fleet’s exposure to weather over a specific timeframe. This assessment not only helps a company determine if its vessels encountered weather conditions exceeding internally defined thresholds but also facilitates benchmarking against other vessels of similar size and on similar routes, whether under the same management/ownership or different.
“Given that most liner operators already have dedicated teams focusing on vessel routing for efficiency and scheduling purposes, expanding their focus to include the aforementioned aspects could enhance safety,” Gard concluded in its analysis.


