The United States was the European Union’s largest maritime freight transport partner in the second quarter of 2022, in terms of total gross weight of goods, with a total of 61 million tonnes, surpassing Russia (57 million tonnes).
Russia came in second position followed by the United Kingdom (55 million tonnes), Türkiye (36 million), China (31 million), Norway (29 million), Brazil (24 million), Egypt (19 million), Nigeria (14 million) and Canada (13 million), in accordance with recent data from Eurostat.
The EU’s transport with the US, Russia and the UK combined represented one-third of total extra-EU maritime freight transport.
Comparing the second quarter of 2022 with the same quarter of 2021, maritime transport between the EU and Russia recorded the largest fall (-22.1%), followed by Brazil (-12.6%). By contrast, traffic between the EU and Egypt and the United States increased substantially over the same period, by 22.9% and 21.1%, respectively.
In the second quarter of 2022, 17 out of the top 20 trade flows were inward movements and 3 were outward movements: outward movements of Ro-Ro mobile units to the United Kingdom (11 million tonnes); and of large containers to China (8 million) and the East Coast of the United States (7 million).
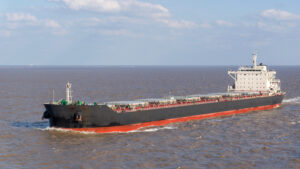
The top 3 inwards movements were of large containers from China (16 million), crude oil from the East Coast of the United States (10.4 million) and oil products from Russian ports on the Baltic Sea (10.4 million). Liquid bulk goods (crude oil, oil products and liquefied gas) dominated inward trade flows.
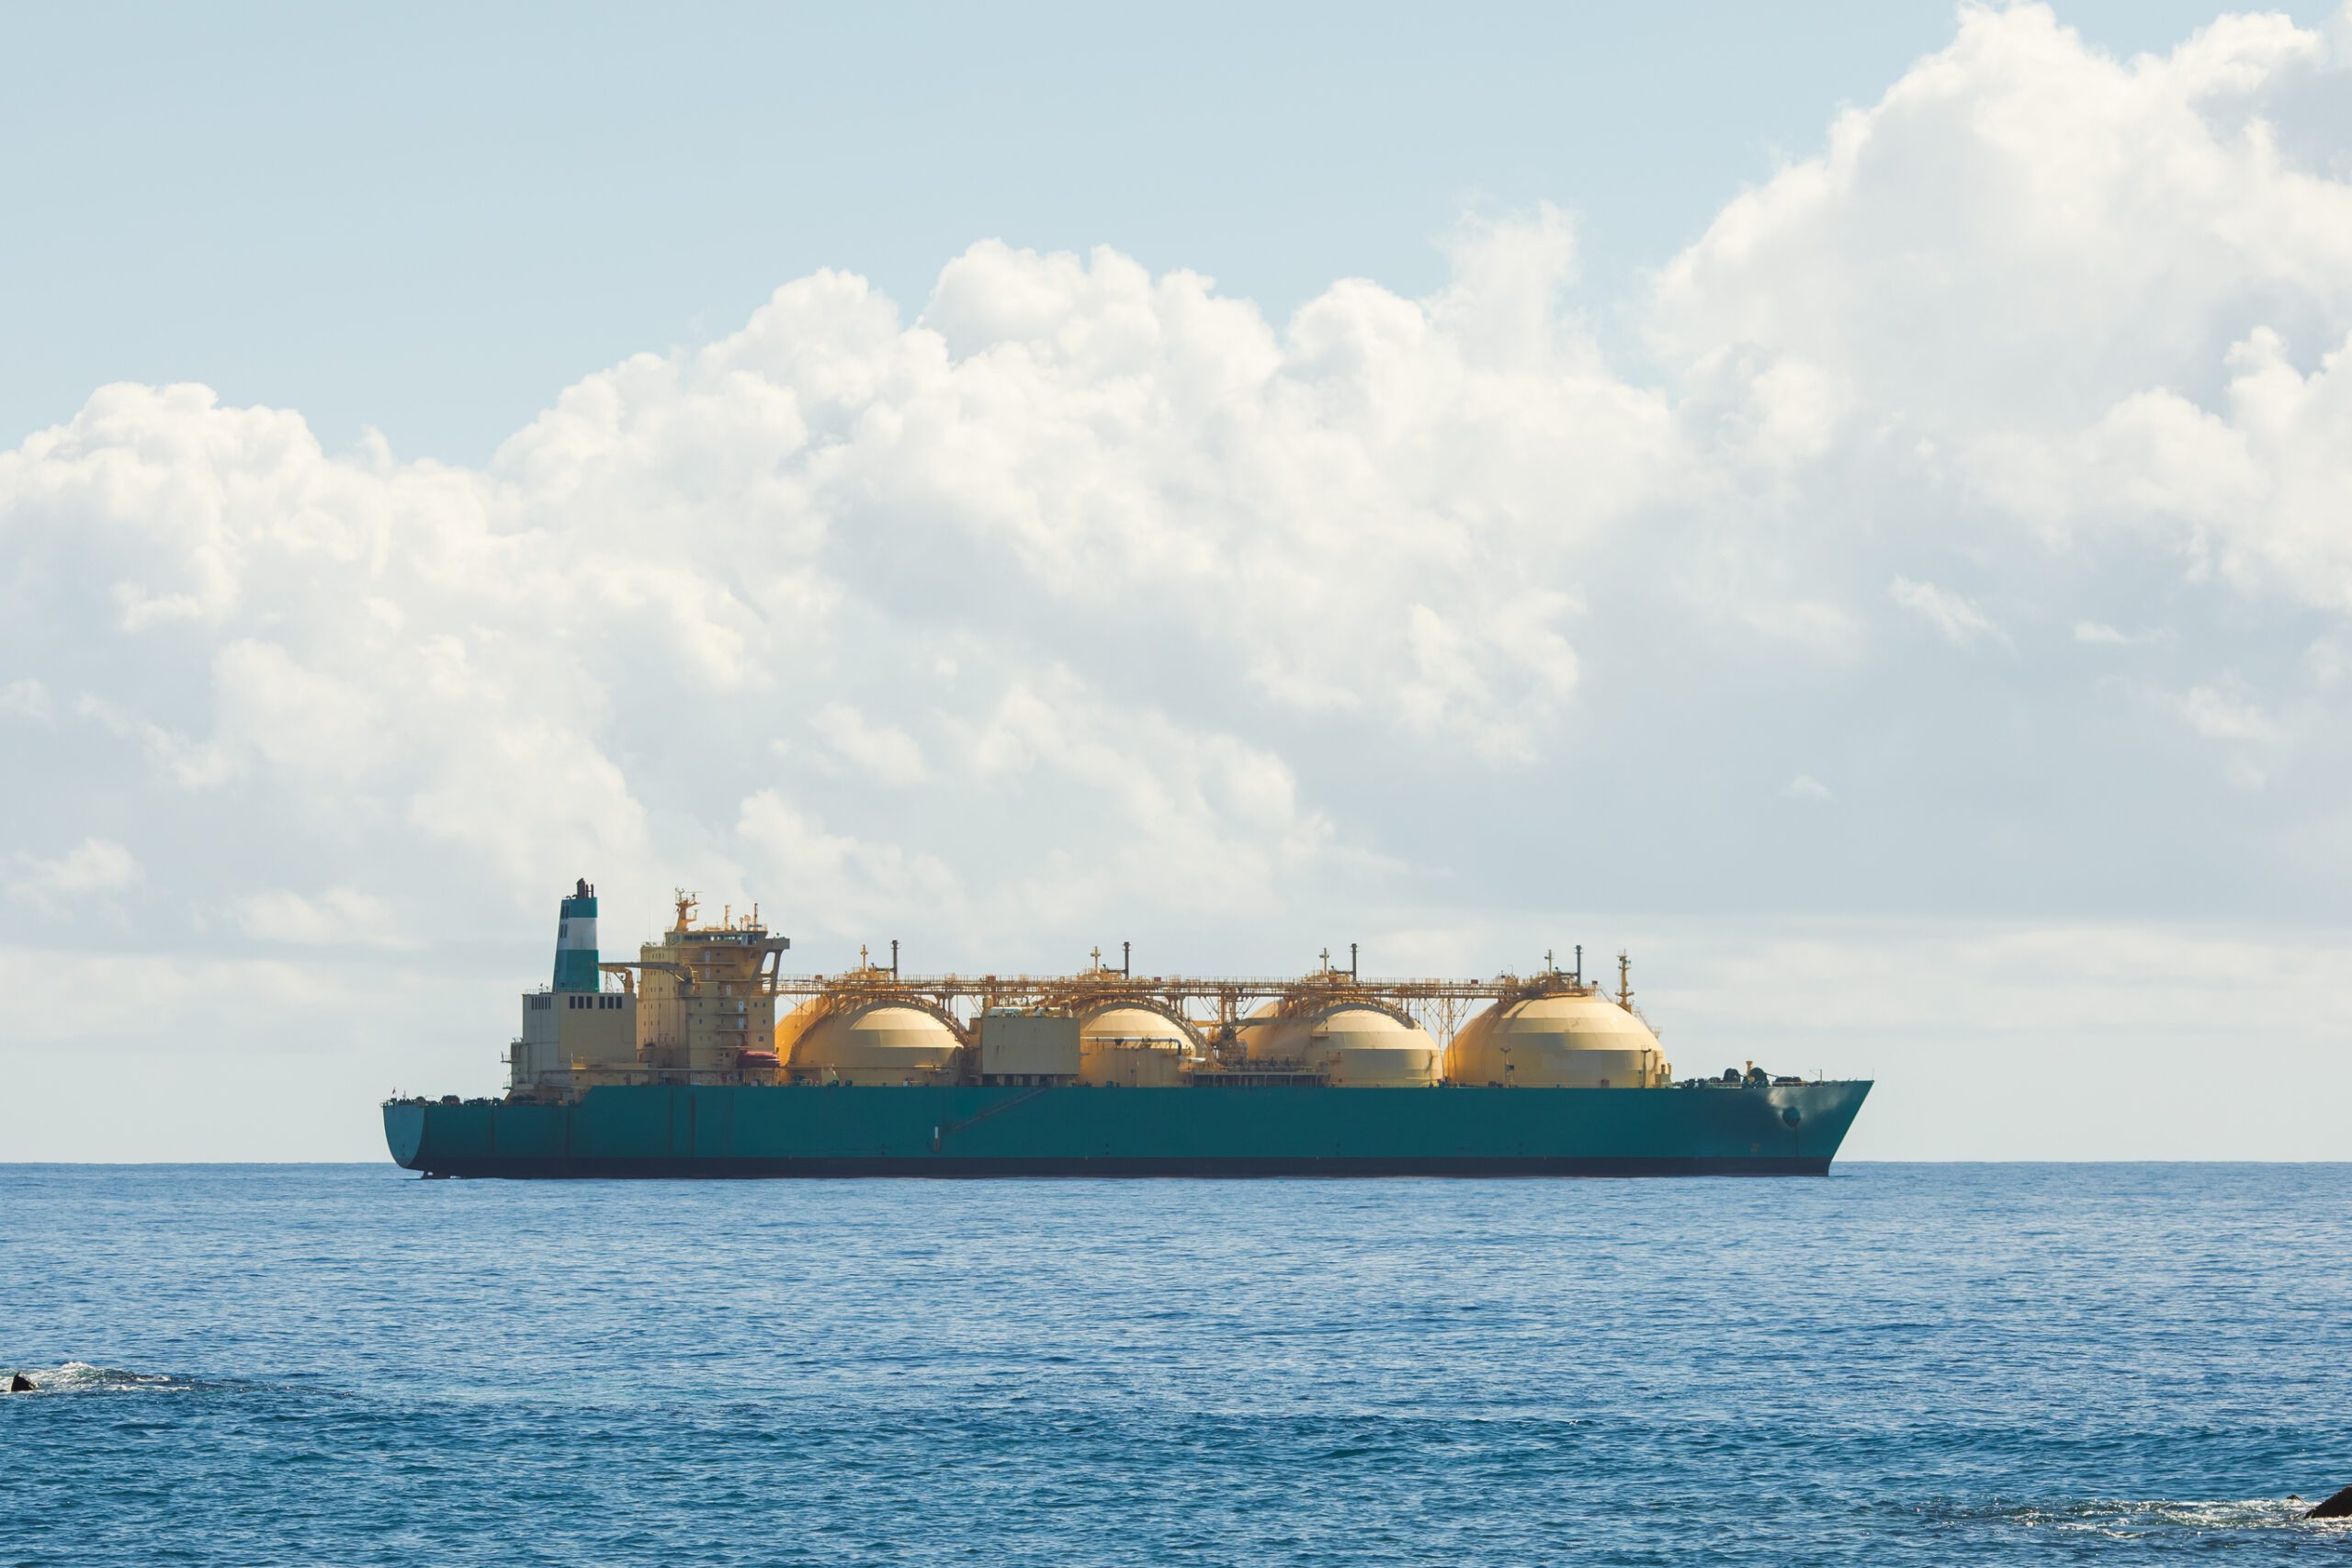
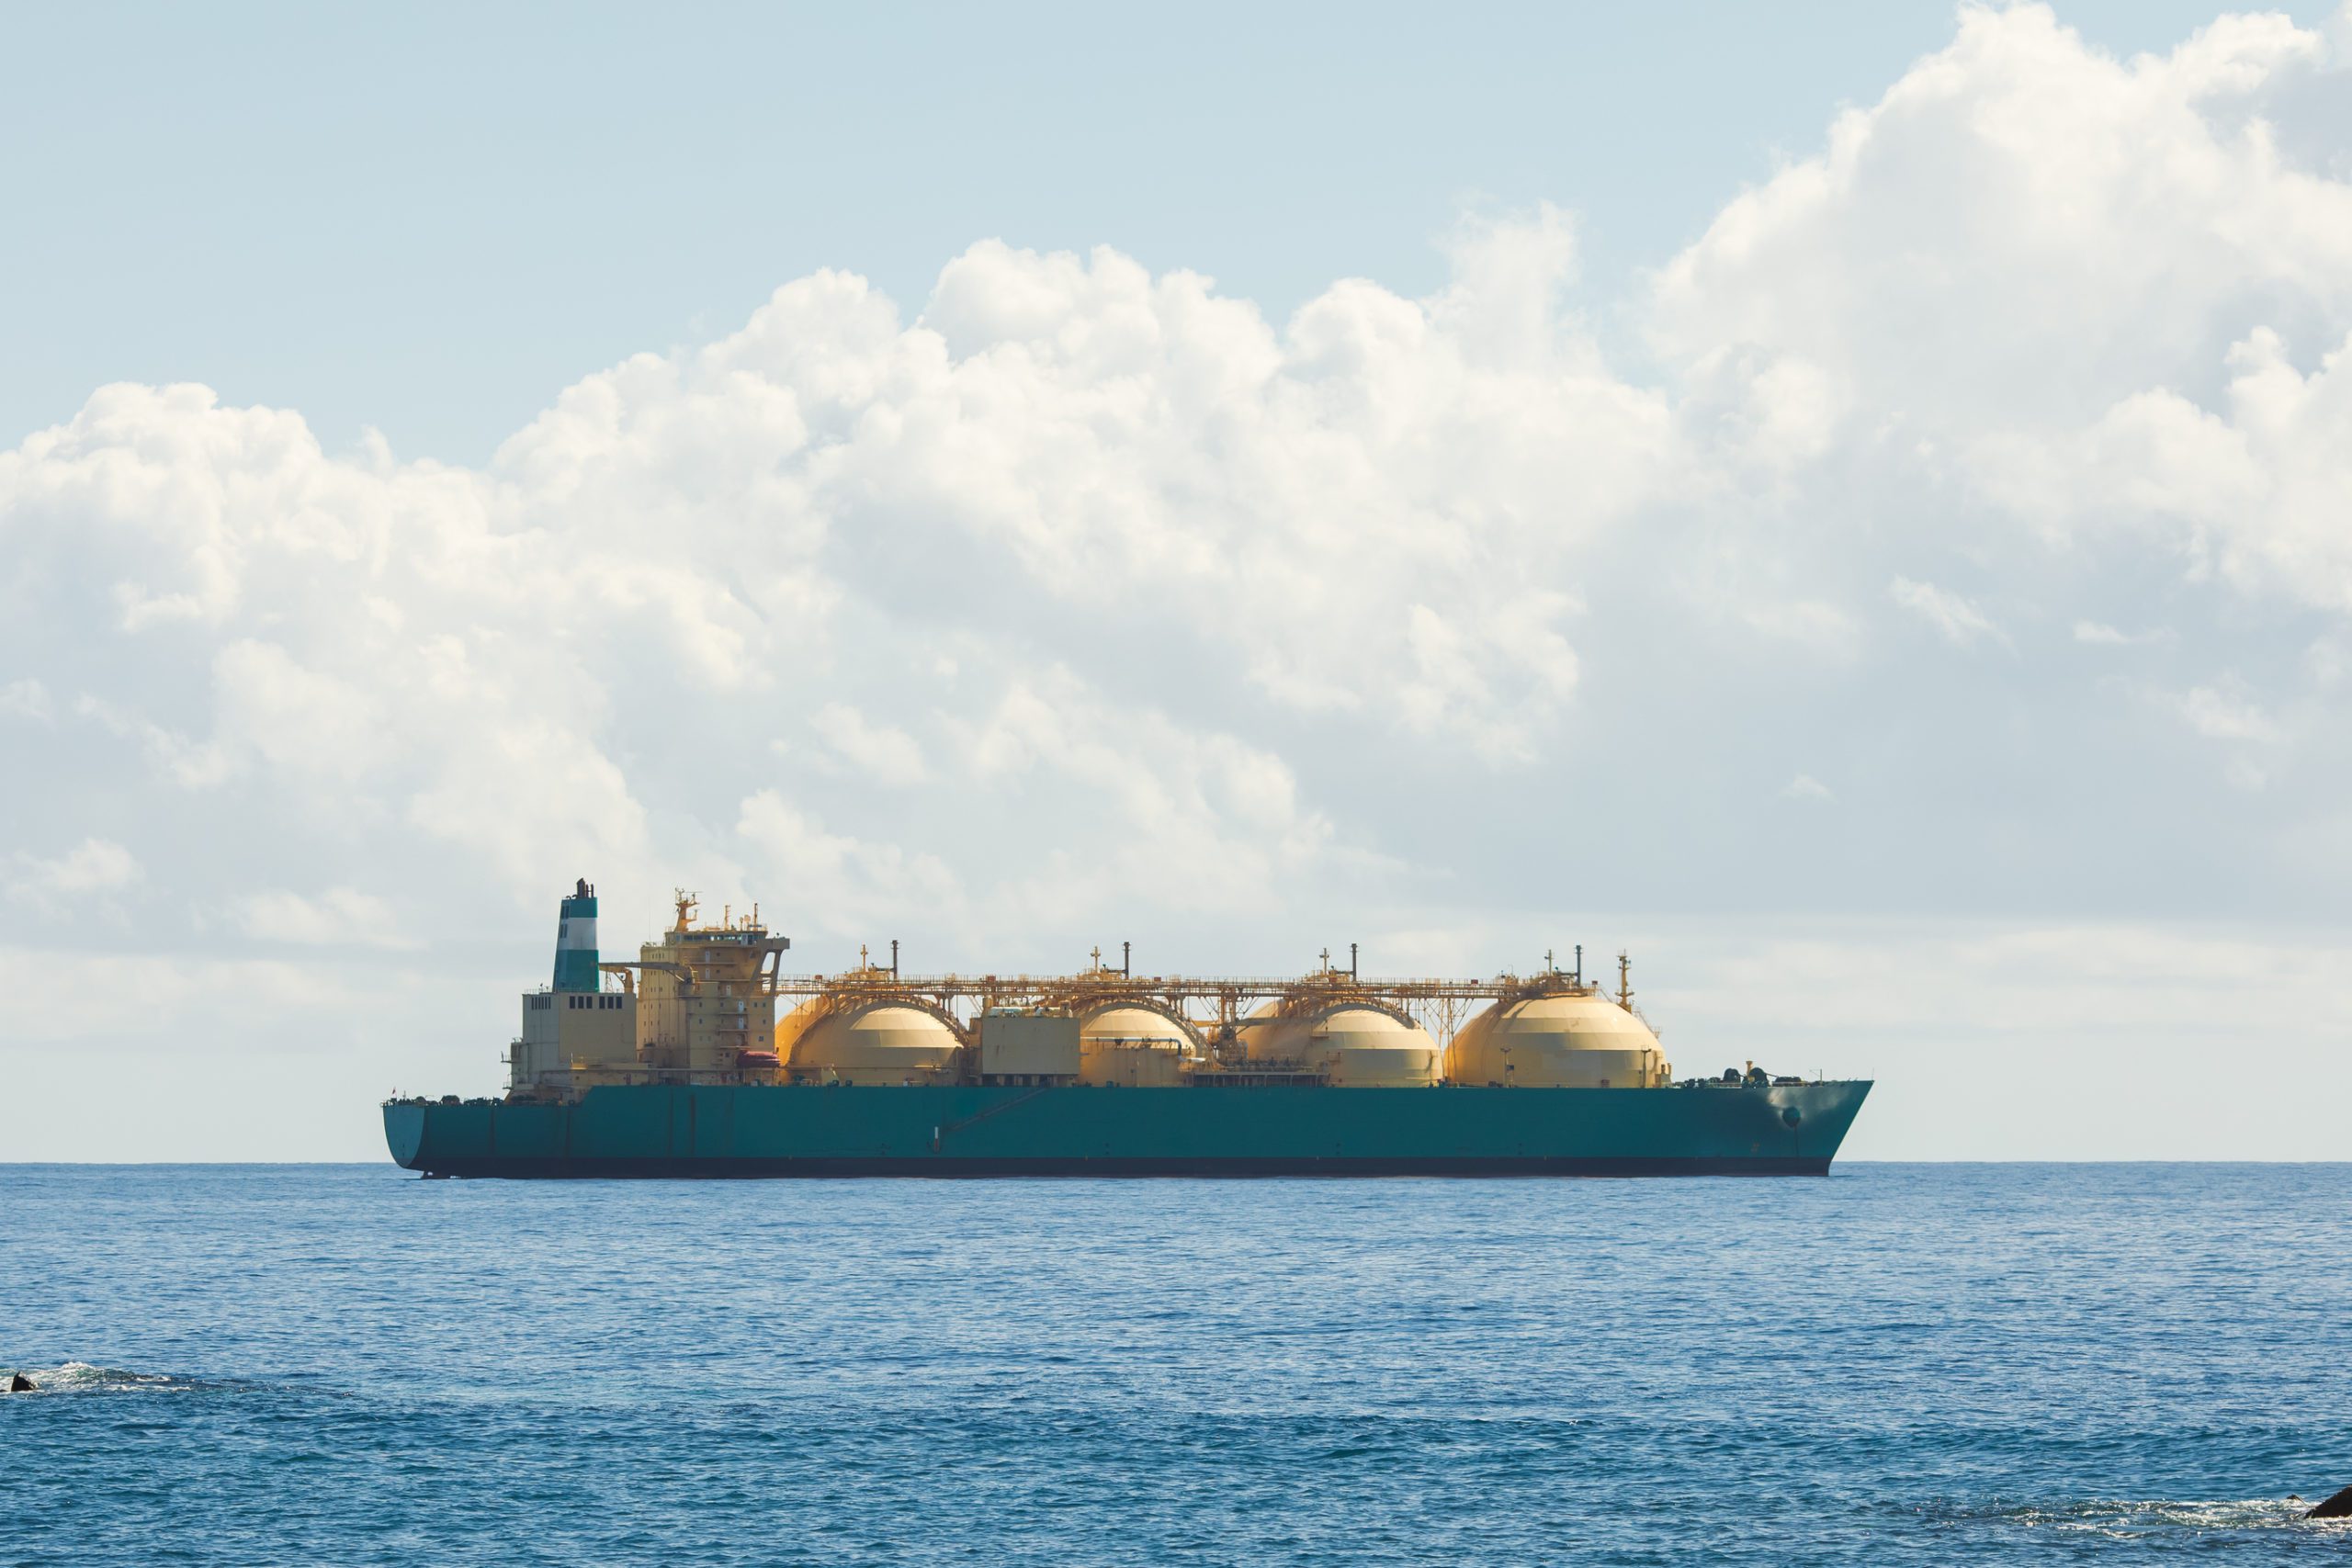
In the second quarter of 2022, crude oil (10 million tonnes) and liquefied gas (9 million) from ports on the US East Coast represented almost one-third (32%) of the total transport between the EU and the United States. Inward movements of coal (7 million) from the same ports in the US were also substantial, representing 12% of the total transport.
Comparing the second quarter of 2022 with the same quarter of 2021, there were substantial increases in inward movements. The biggest increases were in liquefied gas, coal and crude oil from the East Coast of the United States (+87.7%, +85.4% and +64.6%, respectively); and crude oil from Egypt (+86.1%).
By contrast, large decreases were observed for crude oil from Russian ports on the Baltic Sea (-46.6%) and Russian ports on the Black Sea (-24.0%); and ores and agricultural products from Brazil (-34.1% and 14.3%, respectively).
In terms of outward movements, large decreases were observed for large containers to China (-29.2%) and to the East Coast of the United States (-10.4%).